


This is an archived article that was published on sltrib.com in 2013, and information in the article may be outdated. It is provided only for personal research purposes and may not be reprinted.
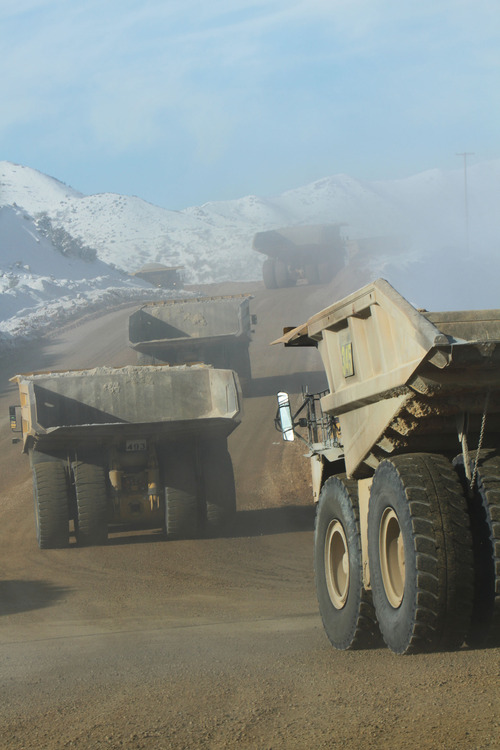
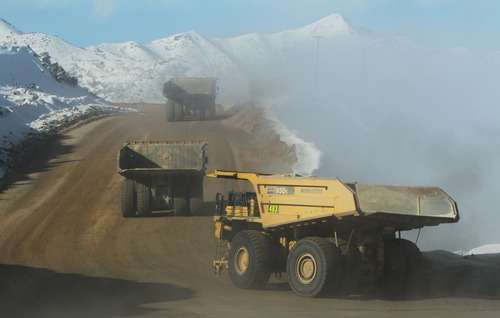
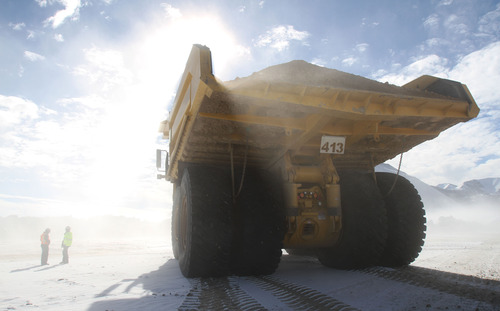
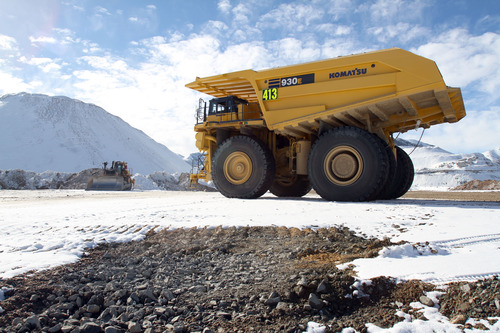
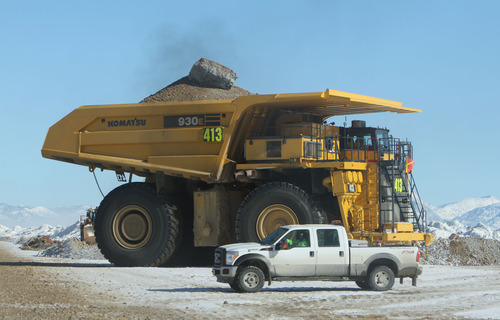
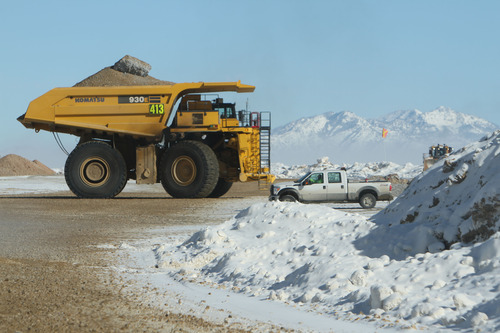
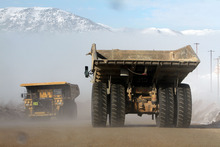
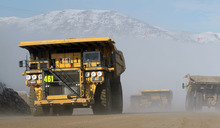
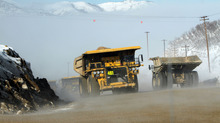
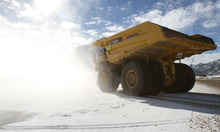
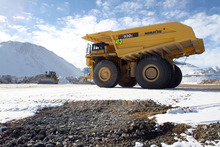
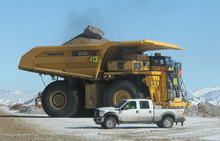
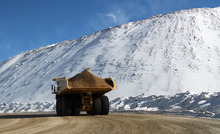
Toxic releases have inched up in Utah, with Kennecott Utah Copper's Bingham Canyon mining operations once again ranked second overall in the nation.
Based on the latest Toxics Release Inventory from the U.S. Environmental Protection Agency, Utah's slight uptick followed a national trend of bigger releases to the air, land and water. Nearly 21,000 companies nationwide reported a total of 4.09 billion tons in 2011, an overall increase of 8 percent of 650 mineral and chemicals considered in the count.
In Utah, 182 facilities handled a total of 196,982,429 pounds, an increase of 21,978,749 pounds or 12.6 percent, for the year.
And, like most years since the EPA began requiring mining companies to include tailings as releases, Kennecott remains exasperated with how a lot of people interpret the data.
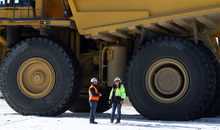
Kelly Payne, who oversees the company's remediation efforts at the massive copper mine in the Oquirrh Mountains, detailed how all but a tiny fraction of the company's total "releases" fit the original definition for TRI releases, the chemical poisons blamed for the 1984 Bhopal, India, disaster and other toxic nightmares.
In contrast, around 99.9 percent of the toxics Kennecott reports are "high-volume, low-toxicity waste rock and tailings that go into permitted, controlled disposal facilities."
Payne noted the waste rock has concentrations of lead, copper and other TRI-reportable constituents that are well the below the human health risk levels that would require an EPA cleanup. And all of the tailings go into the engineered tailings pond just south of the Great Salt Lake.
"The bottom line," he said, "is that we're not putting stuff out there that's a risk" since the waste is isolated and the public is not exposed to it.
Mining operations dominate the top spots on the latest list, as they have since mining waste was added to the annual tally in 1998. Nationally, the metals mining industry was responsible for around 46 percent of total TRI releases, with the Red Dog zinc and lead mine in Kotzebue, Alaska, topping the national list.
In Utah, metals mining accounted for nearly 86 percent or 170,004,619 pounds of the state's total releases. And Kennecott's mine waste accounted for most of that.
The EPA noted Wednesday in a news release that the overall increase in TRI releases is largely due to the mining industry. Even a small change in the chemical composition of the ore being mined can lead to big changes in the amount of toxic chemicals reported nationally, the agency said.
The definitions also landed Salt Lake County in the No. 2 spot nationally (Northwest Arctic Borough, Alaska is No. 1) for the highest volume of TRI releases among counties.
Phil Retallick, senior vice president for compliance and regulatory affairs for Clean Harbors, pointed to another quirk in the data: the hazardous waste received by the incinerator and the landfill his company operates in Tooele County is also counted as "releases" under the TRI.
He noted the actual emissions from the [incinerator] stack are small because EPA standards are so strict and continually getting stricter. Meanwhile, counting the waste that is buried at the Grassy Mountain landfill is a misnomer, he suggested.
"The waste is entombed in a triple-lined landfill," he said.
In a news release, EPA Administrator Lisa Jackson said the TRI is a useful tool for the public.
"It plays a critical role in EPA's efforts to hold polluters accountable and identify and acknowledge those who take steps to prevent pollution," she said. "This remarkable success is due in part to the TRI program and concerted efforts by industry, regulators and public interest groups to clean up the air we all depend upon."
Twitter: @judyfutah —
The top 10 nationally, plus Utah companies in the top 100 with their total releases in pounds.
1. Red Dog, Kotzebue, Alaska • 989,392,549.21
2. Kennecott Concentrators & Power Plant, Utah • 145,338,774.68
3. Newmont Mining Corp. Twin Creeks Mine, Golconda, Nev. • 134,408,150.30
4. Newmont Mining Corp. Carlin, Nev. • 106,615,735.30
5. Bald Mountain Mine, Elko, Nev. • 86,488,721.62
6. Hecla Greens Creek, Juneau, Alaska • 47,043,741.64
7. Newmont Copper Canyon, Nevada • 46,922,685.90
8. ASARCO Ray Complex Smelter & Concentrator, Hayden, Ariz. • 44,293,086.54
9. Barrick Cortez, Crescent Valley, Nev. • 39,160,830.66
10. Coeur Rochester, Lovelock, Nev. • 33,718,626.90
13. Kennecott Smelter & Refinery, Magna, Utah • 23,445,562.07
45. US Magnesium, Rowley, Utah • 8,660,645.58
Total of the Top 100 facilities • 2,525,795,681.57
Source: EPA —
Utah's top 10 total releases (in pounds)
1. Kennecott Concentrators & Power Plant, Bingham Canyon • 145,338,774.68
2. Kennecott Smelter & Refinery, Magna • 23,445,562.07
3. US Magnesium, Rowley • 8,660,645.58
4. Clean Harbors Grassy Mountain, Grantsville • 2,784,725.03
5. EnergySolutions, Clive • 2,495,933.50
6. IPP, Delta •2,102,237.42
7. Bonanza Power Plant, Vernal • 1,703,706.82
8. Nucor Steel, Plymouth • 1,520,888.80
9. Huntington Plant, Huntington • 1,385,871.70
10. Clean Harbors Aragonite, Grantsville • 1,316,620.05
Source: EPA —
Utah's top releases by chemical type (in pounds)
1. Copper compounds • 94,314,098.81
2. Lead compounds • 65,634,566.39
3. Chlorine • 7,472,197.00
4. Zinc compounds • 6,665,681.18
5. Barium compounds • 4,396,920.14
6. Arsenic compounds • 2,738,582.60
7. Hydrochloric acid • 2,329,131.91
8. Nitrate compounds • 1,732,577.62
9. Ammonia • 1,687,524.33
10. Chromium compounds • 1,602,330.27
Source: EPA