
This is an archived article that was published on sltrib.com in 2014, and information in the article may be outdated. It is provided only for personal research purposes and may not be reprinted.
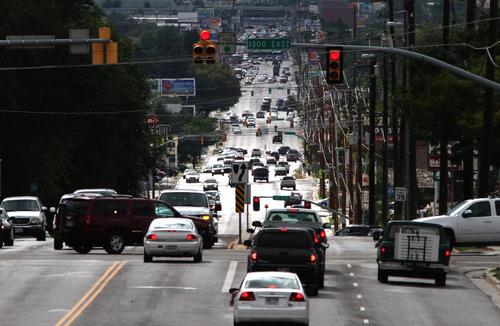
How much do Utahns drive?
Residents of the state combined to drive an estimated 26.53 billion miles in 2012 — enough to cover the distance to the moon 111,000 times. Still, Utah ranked only No. 34 among the states for vehicle miles traveled per capita that year.
That's according to data in the latest edition of "State Transportation Statistics" for 2014, released annually by the U.S. Department of Transportation. It has scores of charts that give a snapshot of transportation in the states.
Following is how Utah or its institutions rank in some other key areas:
Airport • Salt Lake City International Airport ranked No. 1 in both 2012 and 2013 for on-time arrivals among major airports. In 2012, the on-time performance was 88.6 percent. In 2013, it was 85 percent.
The airport also ranked No. 25 for the number of passenger enplanements in 2013, 9.67 million. That put it just behind Chicago Midway airport, and just ahead of Washington Dulles.
Commuting • The average travel time to work in 2012 in Utah was 22 minutes, compared to a national average of 25.7 minutes.
Data show that 75.7 percent of Utahns usually drove to work alone that year; 12.2 percent carpooled; 2.5 percent rode mass transit; 2.6 walked; 4.8 percent worked at home; and 2.3 percent used other modes such as bicycling or taking a taxi.
Nationally, in comparison, 76.3 percent of Americans drove alone; 9.7 percent carpooled; 5 percent rode transit; 2.8 percent walked; 4.4 percent worked at home; and 1.8 percent used other modes.
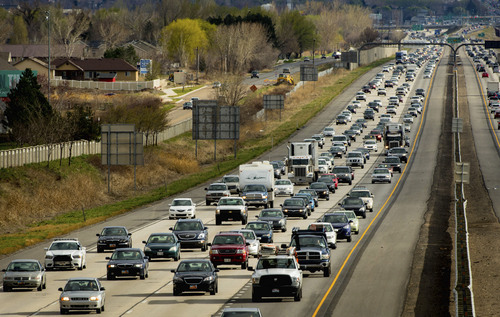
Congestion • A typical Salt Lake City area commuter faced an average of 30 hours of delay from congestion in 2012, No. 42 among the top 50 cities by population.
Delays from that congestion were estimated to cost $449 million overall, or $620 per commuter, which was No. 45 lowest among the top 50 cities.
Overseas visitors • Utah ranked No. 14 among the states for the 476,000 overseas visitors that it attracted in 2012, up from No. 19 in 2002 (the year of the Salt Lake City Olympics).
Safety • The fatality rate in 2012 on Utah's highways was 7.6 per 100,000 residents. That was ninth lowest among the states. Nationally, the rate was 10.7 per 100,000 population.
Number of vehicles • Utahns actually registered more trucks than cars in 2012.
However, the U.S. Transportation Department's definition of trucks includes pickups, semis, vans and SUVs.
Transportation data also show that Utahns registered 1.06 million trucks, 824,000 cars, 63,000 motorcycles and 4,000 buses.