


This is an archived article that was published on sltrib.com in 2016, and information in the article may be outdated. It is provided only for personal research purposes and may not be reprinted.
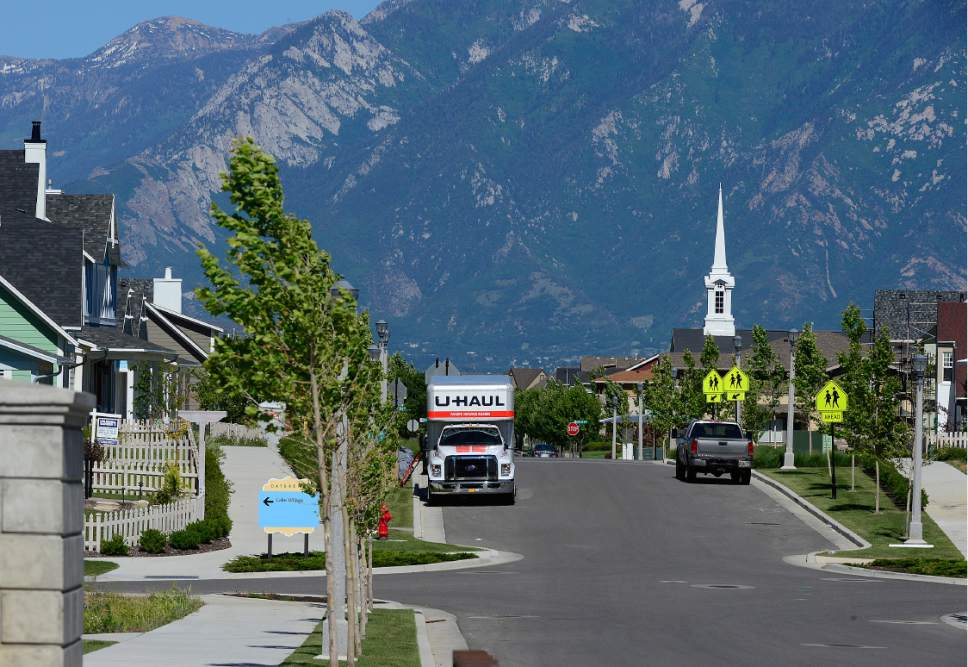
Utahns moved more than most Americans in 2015, when nearly one of every six changed residences.
More precisely, 17.3 percent of Utahns moved into new homes or apartments last year, compared with a national average of 14.7 percent.
That's according to new estimates from the American Community Survey by the U.S. Census Bureau, and were among several sets of migration data released Wednesday.
Of the nearly 512,000 Utahns who moved in 2015, estimates said 76 percent resettled within the state; 19 percent came from different states; and about 5 percent came from abroad.
That high rate of moving is another sign that Utah has recovered from the Great Recession, says Pam Perlich, demographics director at the University of Utah's Kem C. Gardner Policy Institute.
"The Great Recession was at its worst in 2010," she said. "Migration within the state of Utah and across state lines was minimal then. People were just staying put."
Perlich said that as Utah's economy improved, mobility increased. Now, the state is seeing more people move in than are moving away.
She said numerous other reasons are behind the new mobility.
"Many young adults had not been able to form independent households because of the recession," she explained. "As the economy has improved, we're starting to see young adults be able to form them."
With an improving economy, she said, more people also are confident enough to retire — and more are moving into retirement housing.
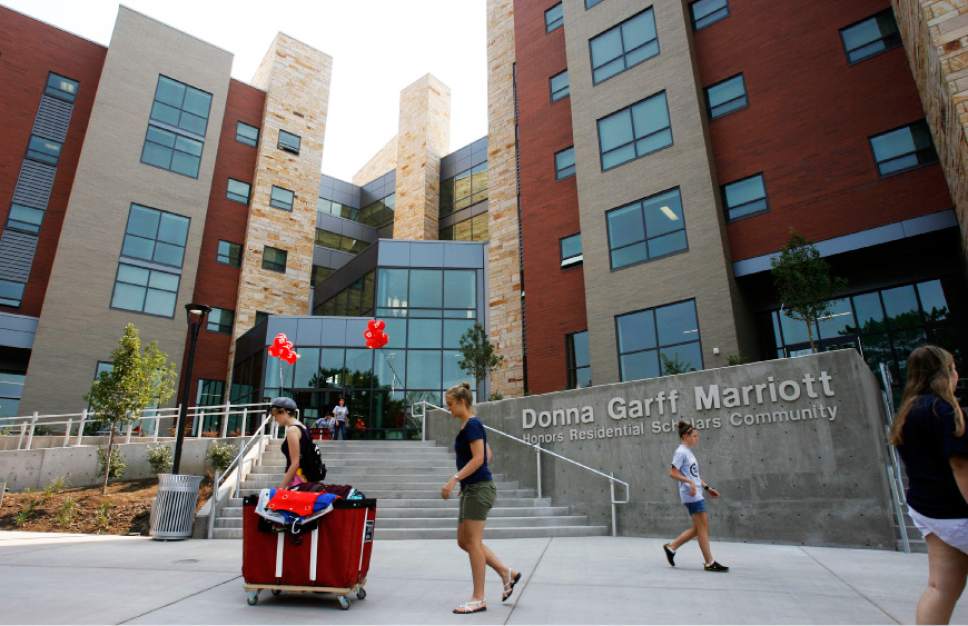
In addition, "Utah has a lot of educational opportunities," she said, and that has been attracting students from out of state.
The top 10 states from which new Utahns arrived during 2015 include: California, 18,154 people; Texas, 8,698; Arizona, 7,850; Idaho, 6,413; Washington, 5,426; Nevada, 5,073; Colorado, 3,964; Pennsylvania, 2,710; Wyoming, 2,609; and Florida, 2,383.
The list of top destination states to where Utahns moved that year was similar.
Those states include: Arizona, 10,165 people; California, 8,814; Texas, 6,583; Idaho, 6,625; Nevada, 3,845; Washington, 5,827; Colorado, 4,064; Wyoming, 3,725; Pennsylvania, 2,073; and Florida, 1,932.
Perlich said migration to and from Utah tends to be with nearby states or large states.
She said Texas finishing high on the lists is not a surprise because "there's a lot going on in Texas" with a hot economy there, so the two states are swapping workers and residents.
Other data released Wednesday included a look at county-to-county migration between 2010 and 2014.
It said, for example, that an average of 16 percent of Salt Lake County residents moved in those years.
Of the typical 167,000 people who moved there annually, the top counties from where they migrated were: Utah County, 6,258; Davis County, 4,552; Weber County, 1,545; Washington County, 1,291; and Tooele County, 1,186.
Another set of figures released Wednesday — looking at more recent periods — said the percentage of Americans moving over a one-year period fell to an all-time low to 11.2 percent in 2016.
That came from the Current Population Survey Annual Social and Economic Supplement by the Census.
"People in the United States are still moving, just not to the same extent as they did in the past," said David Ihrke, a survey statistician in the Census' Journey-to-Work and Migration Statistics Branch. "The decision to move can be personal and contextual. What causes one person to move might not be enough to convince another."
Among those who moved nationally in 2016, 42.2 percent said they did so for a housing-related reason, such as wanting a new or better home or apartment.
Also, 27.4 percent said they moved for a family-related reason, 20.2 percent said they pulled up stakes for employment and 10.2 percent said they left for some other reason. —
Top states from which new Utahns migrated
1 • California, 18,154 people
2 • Texas, 8,698
3 • Arizona, 7,850
4 • Idaho, 6,413
5 • Washington, 5,426
6 • Nevada, 5,073
7 • Colorado, 3,964
8 • Pennsylvania, 2,710
9 • Wyoming, 2,609
10 • Florida, 2,383.
Source: U.S. Census Bureau; 2015 statistics.